

May 2026 D.C. Metro Housing Market Report: Spring Is Running Late — and Running Strong
By Justin Levitch, President of RLAH @properties | May 2026 Monthly Market Report

Spring 2026 started slow, then flipped. Two consecutive months of rising sales, pendings trending up across the board, and a rental market that’s loaded with listings but only renting half of them in D.C.
Every month, our team researches and presents a market report to RLAH agents covering the latest data across the D.C. metro. It’s one of many tools our agents use to keep their clients informed throughout the entire buying or selling process. Here’s a sample of what we covered this month.
Is the D.C. Metro Housing Market Actually Recovering in 2026?
Four years into suppressed sales volume, the answer is finally yes — quietly. According to BrightMLS closed sales data through April 2026, the D.C. metro just posted two consecutive months of year-over-year sales increases. That hasn’t happened since January 2025. The market has been giving people every excuse not to transact — rates, prices, headlines — and demand is still slowly climbing through it. If this is as bad as it gets, the market is still making money. The takeaway: small improvements in any of the affordability inputs would tip a much bigger wave of buyers off the sidelines.

Are D.C. Metro Home Sales Trending Up in 2026 or Just Bouncing?
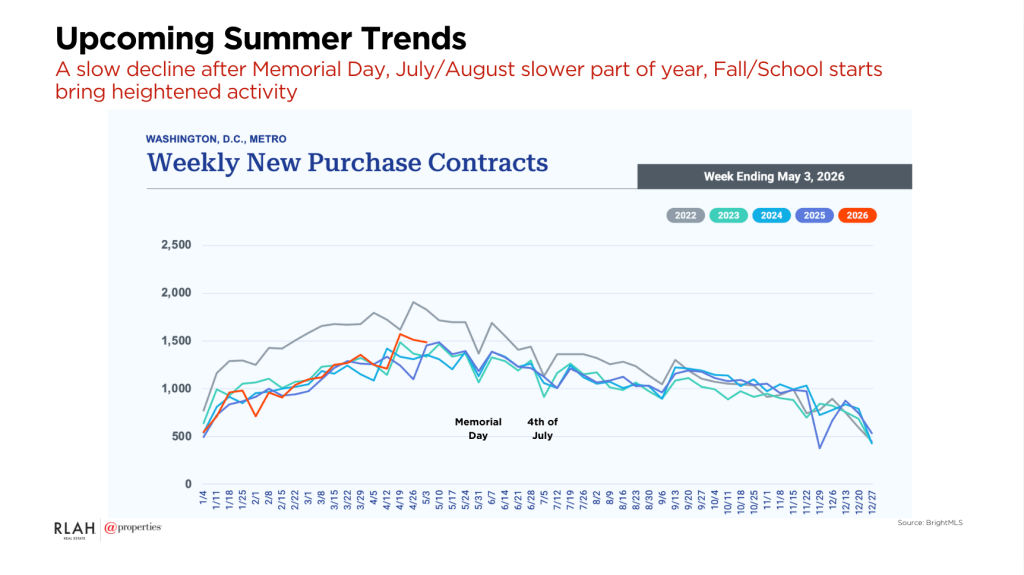
This is where the data gets more interesting. January and February 2026 closed sales were weak across the metro — most agents felt it. But March and April were two of the brokerage’s best months ever, and pending sales are trending up every single month of 2026. Pendings lead closings by 30–45 days, which means May and June closed sales are almost mathematically locked in to beat last year. Spring 2026 didn’t start on time. It started in March and is still acceleratin
Which D.C. Metro Counties Are Performing Best in Q1 2026?
The headline number — flat metro-wide closed sales — hides the real story underneath. According to BrightMLS year-to-date data through April 2026, every jurisdiction is converging toward flat. Montgomery County is now running about +4% year-over-year, up from +5% the month prior. Washington D.C. is at -9%, a meaningful improvement from -15% the month before. The strongest markets are cooling slightly. The weakest markets are recovering. Everything is moving toward the middle on both sales and prices.
What Does Housing Affordability Look Like in the D.C. Metro Right Now?
Affordability isn’t one number. It’s three: mortgage rates, home prices, and wage growth. Rates have eased modestly. Home prices in the D.C. metro have gone flat after years of climbing even through reduced sales volume. Local wage growth is the soft spot at about 0.1%. But here’s the math: when prices stop rising and rates moderate even slightly, the affordability equation tips for an entirely new pool of buyers — even at slow wage growth. That’s exactly the dynamic playing out in the March and April numbers.

Is the D.C. Metro Rental Market Absorbing the Listings That Are Coming On?
This is the question most sellers aren’t asking — and they should be. Four years of suppressed home sales should mean a red-hot rental market. The data says otherwise. According to BrightMLS rental data across D.C., Montgomery County, and Alexandria/Arlington, new rental listings are up 10–15% year-over-year in most jurisdictions. Active rental listings in D.C. are up roughly 30% year-over-year — sellers converting to landlords rather than transact.
Now the rental absorption rate — active rental listings divided by rentals closed — tells the real story. In D.C., only about 1 in 2 rental listings actually gets rented. Put your house up for rent in D.C. and you have a 50% chance of finding a tenant at all. Suburban Maryland and Northern Virginia rentals are absorbing at much higher rates, but D.C. specifically is oversupplied. For sellers thinking “fine, I’ll just rent it” — the data does not support that as a sure thing right now.


What Do Mortgage Purchase Applications Tell Us About the Next 90 Days?
Mortgage purchase applications are one of the earliest leading indicators we track, because the typical buyer is roughly 10 weeks from pre-approval to under contract. February 2026 applications fell off a cliff — bad enough that the deceleration was worth waiting a month to discuss. March came back strong and was up year-over-year. By the typical 10-week lead time, that February dip should be hitting closings right now in April and May. Instead, contracts and pendings are flying. That mismatch is the most encouraging signal in the data: spring 2026 is running hotter than the leading indicators predicted, which suggests the spring window extends past Memorial Day this year.

When Does the D.C. Metro Spring Market Actually End in 2026?
Memorial Day is the close-out of spring. Historically, there’s a slight dip in showings the weekend of Memorial Day, then a deceleration into Fourth of July, then a long taper through August. July and August are the two slowest months in this market. Activity picks back up the weekend after Labor Day — and that post-Labor-Day window is typically stronger than August. The practical takeaway for sellers right now: if a listing is going on the market this month, the highest-traffic window of the year is between now and Memorial Day weekend.
Are Condos Recovering in the D.C. Metro?
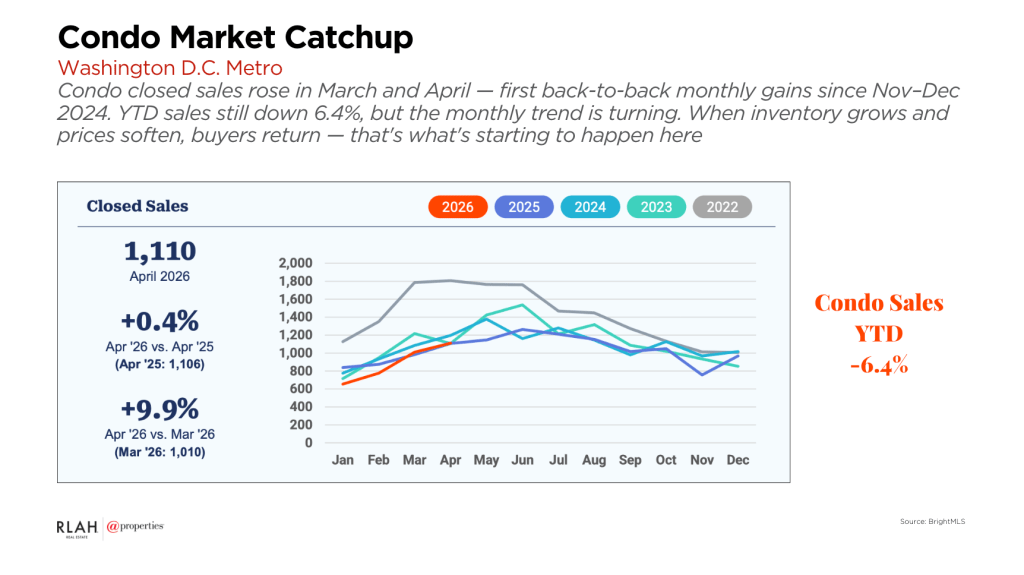
Cautiously, yes. For the first time in this cycle, the D.C. metro has posted two consecutive months of year-over-year condo sales increases. Volume is still low — condos are not back to where they should be — but two up months in a row is the first signal that segment may have hit the bottom.
Are D.C. Metro Home Prices Going Up or Down in Q1 2026?
Flat. According to BrightMLS Q1 2026 price data, detached home prices are up 2.2% over Q1 2025 — barely anything. Every other property type is essentially flat year-over-year. This matters because for two years, prices kept climbing even as sales volume dropped. That dynamic has ended. Sellers aren’t losing value, but they’re not gaining either. Pricing accurately from day one — not relying on appreciation to save a stretched list price — is the strategy that works in this market.

Key Takeaways from the May 2026 D.C. Metro Market Report
- Spring started late but is running strong. Two consecutive months of year-over-year closed sales increases — the first time since January 2025. Pendings are trending up every month of 2026, meaning May and June closings are locked in to beat last year.
- The market is converging toward flat. Strong counties are cooling slightly. Weak counties (D.C., Prince George’s) are recovering. Montgomery County is now at +4%, D.C. improved from -15% to -9% year-over-year.
- Affordability is finally tipping. Prices are flat, rates have moderated, and even at 0.1% wage growth a new pool of buyers is becoming eligible to transact.
- The rental market is not the safe alternative for D.C. sellers. Active D.C. rental listings are up 30% year-over-year, and the absorption rate is roughly 50% — only half of D.C. rentals actually get rented.
- Mortgage purchase applications fell off a cliff in February and recovered in March. Spring 2026 is outperforming what the leading indicators forecast, which suggests the spring window extends past Memorial Day.
- Memorial Day is the close-out of spring. The highest-traffic showing window of the year is now through Memorial Day. July and August are the slowest months. Post-Labor Day is typically stronger than August.
- Condos may have hit bottom. Two consecutive months of year-over-year condo sales increases — the first positive signal in that segment in this cycle.
- Prices are flat. Detached up 2.2% in Q1 2026. Every other property type essentially flat. Day-one pricing is the strategy.
The spring market is running later and stronger than the leading indicators predicted. Sellers have a roughly two-week window of peak showing traffic between now and Memorial Day. Anyone betting on the rental market as a fallback in D.C. specifically should look at the absorption data first.
Full May 2026 Market Report
Flip through the complete slide deck below for all the data and visuals behind this analysis:
About this report: This monthly market report is produced by Justin Levitch, President of RLAH @properties, and his team. Each month they analyze BrightMLS, SmartCharts, Redfin, and Mortgage Bankers Association data for the greater Washington D.C. metro area — including Washington D.C., Arlington, Alexandria, Montgomery County, Prince George’s County, and Fairfax County — and present the findings to RLAH agents so they can better advise their clients. Published monthly at blog.rlahre.com.
Data sources: Mortgage Bankers Association, BrightMLS Weekly Market Report (weekly showings, new listings, contracts, days on market, months of supply, fall-through rate, listing failures)

